Home Dashboard
Unizo console opens to the Home dashboard when you log in to an existing account. The Home dashboard help you monitor API usage, event notifications, integrations, and traffic patterns across your organization.
Total API Requests

Total API Requests Graph
The Total API Requests graph provides a visual representation of successful and failed API requests over time. This comprehensive view enables you to monitor API performance and reliability, quickly identifying trends, patterns, or potential issues that may require attention. Use this data to optimize your API strategy and ensure consistent service delivery.
Total Events Requests

Total Events Requests Graph
The Total Events Requests graph displays event request volume and frequency over your specified time frame. This visualization helps you track event patterns, identify peak usage periods, and detect anomalies that may indicate system issues or opportunities for optimization. Monitor this data to ensure your event processing remains efficient and responsive.
Integrations

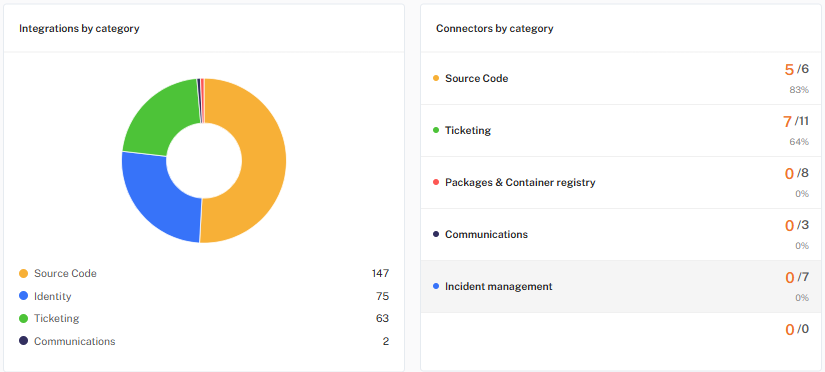
Integrations Distribution
The Integrations pie chart presents a clear breakdown of integration distribution across various domains and service categories. This visualization offers immediate insights into your integration portfolio, helping you understand resource allocation, identify dominant service types, and make strategic decisions about future integrations and optimization efforts.
Errors

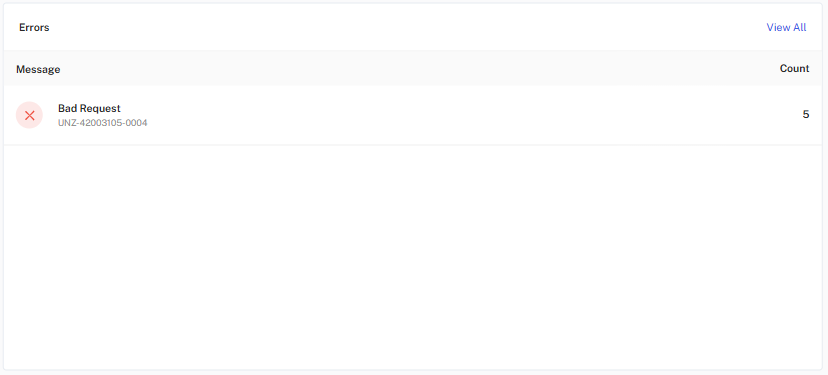
Integration Errors Overview
The Errors section displays the top 5 integration error counts, providing immediate visibility into the most frequent issues affecting your integrations. This critical monitoring view helps you prioritize troubleshooting efforts, identify recurring problems, and maintain system reliability.
For additional support, contact our team at support@unizo.ai.