Integrations Monitoring
Unizo's Integration Monitoring provides a live, consolidated view into external service connectors made by your users. By always keeping integrations observable, we help you maintain high availability, detect failures early, and ensure consistent operations for your customers.
Accessing Integrations from Unizo Console
Integrations Metrics
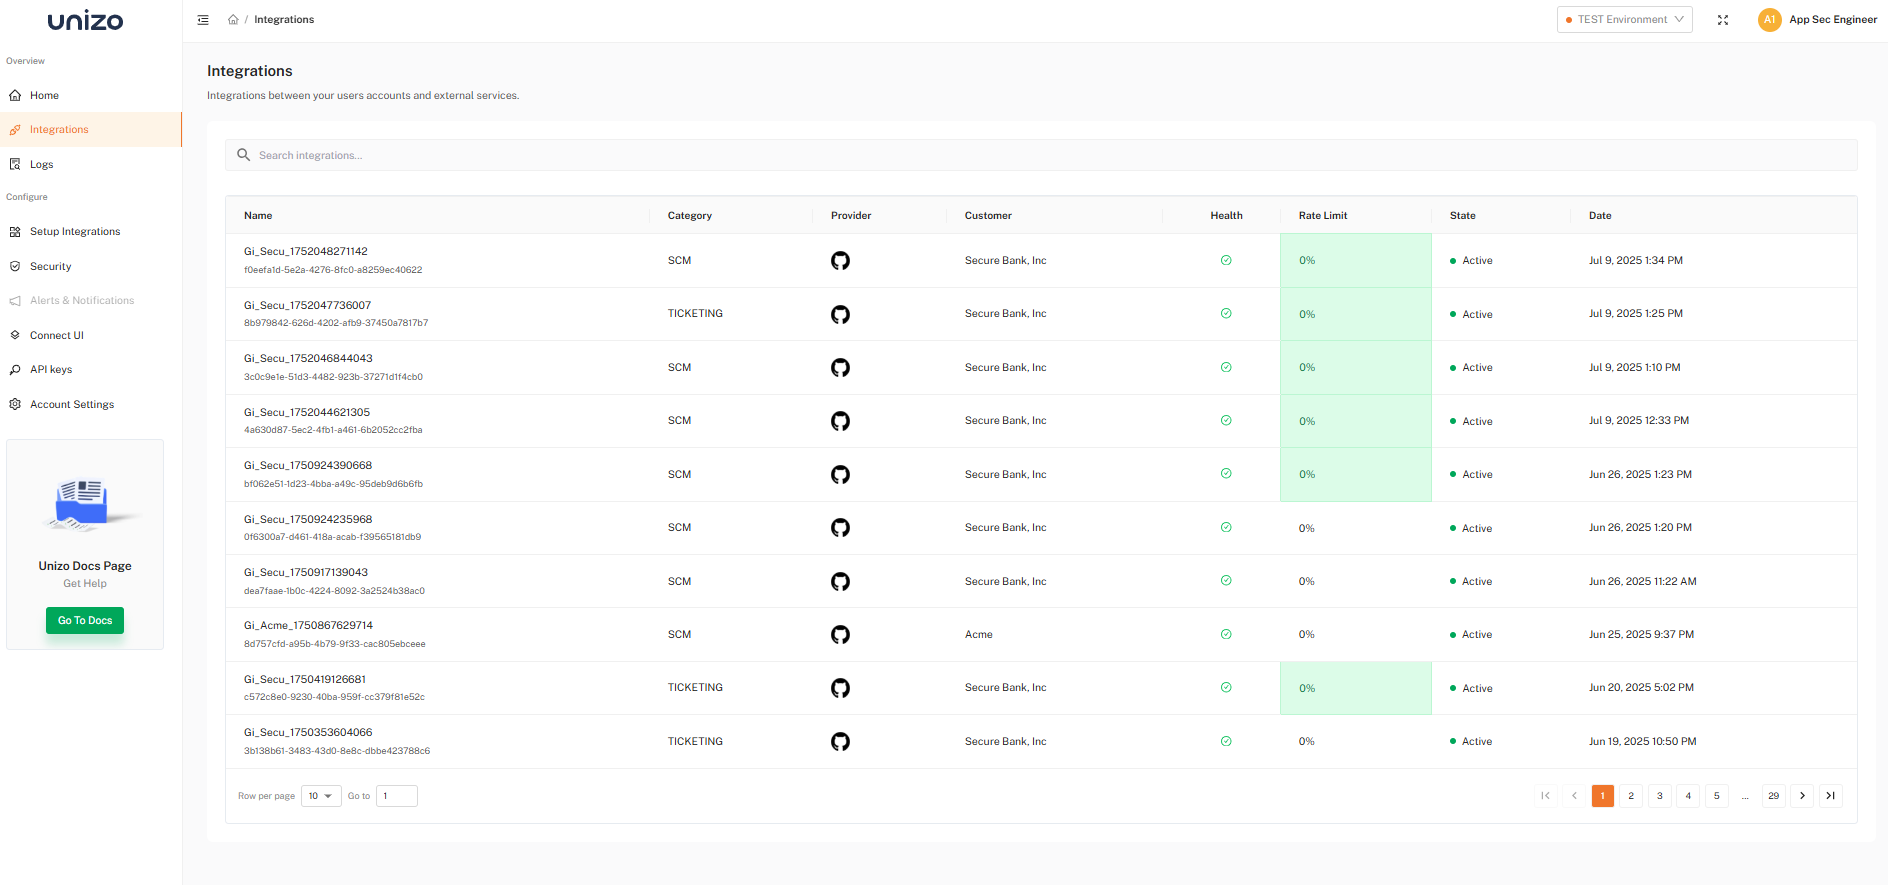
- In the Unizo Console, navigate to Integrations from the sidebar.
- Click on any integration to access detailed activity data, including logs, rate limit and health status.
- Use the search and filter options to find integrations by metadata such as Integration Name, Category, Provider, State, Created Date or Updated Date.
- When an integration is created, the following fields are automatically captured and shown in the console:
- Name: A unique identifier for the integration.
- Category: The type of service (e.g., CRM, ticketing).
- Provider: The specific third-party service being connected.
- Customer: The account or user associated with the integration.
- Health: Displays operational status with green check indicator.
- Rate Limit: Shows current usage as a percentage.
- State: Shows whether the integration is Active or Inactive.
- Date: Shows integration created date and time.
Integration Monitoring Features
Logs and Activity
Comprehensive activity logging for API requests and webhook events, providing detailed records for monitoring and troubleshooting.
View Logs and Activity Details
Rate Limit
Monitor API consumption statistics to ensure fair and efficient use of APIs and prevent service interruptions.
View Rate Limit Details
Health Check
Real-time operational status monitoring with visual indicators to maintain high availability and detect failures early.
View Health Check Details
For additional support, contact our team at support@unizo.ai.